Which Patients Are More Likely to Contract Bacterial Infections in Hospitals? NC State Researchers Use Machine Learning to Find Out
A new study led by a College of Veterinary Medicine Ph.D. student and faculty member used artificial intelligence to determine a link between sociodemographic factors and the diagnosis of health care-associated infections.
Since the COVID-19 pandemic, infectious disease researchers have increasingly sought to understand the role racial and sociodemographic factors play in disease spread to help identify who might be more vulnerable to infection.
A new study led by the NC State College of Veterinary Medicine and funded by the Centers for Disease Control and Prevention used machine learning, an algorithm-focused type of artificial intelligence, to determine whether these variables factored into the diagnosis rates of five common types of health care-associated infections, or HAIs, across four hospitals in a major U.S. city.
Lead researchers Umang Joshi, a fourth-year Ph.D. student in bioinformatics, and Dr. Cristina Lanzas, a professor of infectious disease, found a link between racial and sociodemographic factors and rates of HAI diagnosis, with white patients and those who are wealthier more likely to be diagnosed with infections than patients from other backgrounds. Further research is needed to investigate the reasons why.
Joshi will discuss these findings Wednesday at the College of Veterinary Medicine’s annual Litwack Research Forum. The forum is named in honor of Dr. Martin Litwack, a Raleigh veterinarian and an early advocate of the College of Veterinary Medicine.
Ahead of Joshi’s presentation, he and Lanzas explained how their interdisciplinary research came together to help address health care disparities.

Q: How would you best summarize your research?
UMANG JOSHI: We already know that there are certain risk factors associated with health care-associated infections, such as comorbidities, length of hospital stay and antibiotic use. Our goal was to see, despite those risk factors, do age, race, sex and other sociodemographic factors like social vulnerability indices play a role in determining or informing anything about health care-associated infection?
The Social Vulnerability Index is calculated by the CDC and is mainly used for disaster relief. It’s a composite variable with four components — socioeconomic status, infrastructure, housing composition and minority status — that can identify populations by ZIP code that are particularly at-risk when faced with hazards.
Our study focused on Clostridioides difficile, Enterobacter spp., Enterococcus spp., Pseudomonas aeruginosa and Staphylococcus aureus infections, and we used machine learning to determine if these other factors could predict whether or not a patient ended up being diagnosed with an HAI. We found that racial and sociodemographic factors were important predictors for HAI incidence, even taking into account those other established risk factors.
DR. CRISTINA LANZAS: After researchers realized how disproportionately certain groups were affected with COVID, there’s been a reassessment by the CDC and infectious disease researchers to take a step back and think about how socioeconomic status could affect health disparities for different diseases.
Q: What impact will your recent discoveries have within your field?
JOSHI: I think it boils down to equity. We need to understand how and why certain groups are impacted and determine how we can better care for those groups. This is so important because race and sociodemographic factors have been, as Cristina mentioned, very understudied.
My goal is pretty straightforward: Get the information out there as it appears. We’re still determining how machine learning can apply when evaluating risk factors and different variables in health care, and I’m contributing by figuring out how it can be used in this context and whether it’s equatable to classical statistical methods. I think it’s important to bridge that gap between computer science and statistics and use machine learning to highlight opportunities where more information could be gleaned.
LANZAS: Infectious disease researchers are always trying to identify new ways of controlling disease. For health care-associated infections, we practice classic types of infection control with hand washing and things like that, but for a long time we’ve been in a little bit of a plateau. Working to find new ways to identify who is at risk and bringing that understanding to the table is always useful for finding new methods of disease control.
Also, this study emphasizes the need for better health care data. When we used to describe race in the context of disease, we would say, ‘Race is a risk factor,’ when in reality it’s not. It’s a marker for something else. And that’s why we are trying to bring in these other components, such as the vulnerability indices, to try to explain some of that variation and understand what the underlying factors that influence disease incidence are. Who gets to the hospital in the first place?
In studies like this, we can indicate what kind of data we should be collecting in the future to be able to address those questions. If you send biased data to the algorithms, the algorithms will tell you a biased story. When we make predictive models, we want to make predictive models that work for all the groups of the population.
When we make predictive models, we want to make predictive models that work for all the groups of the population. -Dr. Cristina Lanzas
Q: What was it like working with your research team? Who was involved?
JOSHI: The abstract credits NC State Lanzas Lab members Adam Cline, Liton Chandra Deb, Dr. Sankalp Arya and Dr. Alba Frias-De-Diego.
It’s been a very good learning experience. There are a lot of people with a lot of different backgrounds involved, because we are drawing on a lot of different fields here. For example, we needed biology to understand the risk factors and what goes into disease incidence and is associated with it. I can’t approach this with just a machine learning brain, because if I disregard the biology, then I’m sort of tanked. I can’t disregard the statistics, either, because if I disregard the results that the model is giving me, then my model is not accurate.
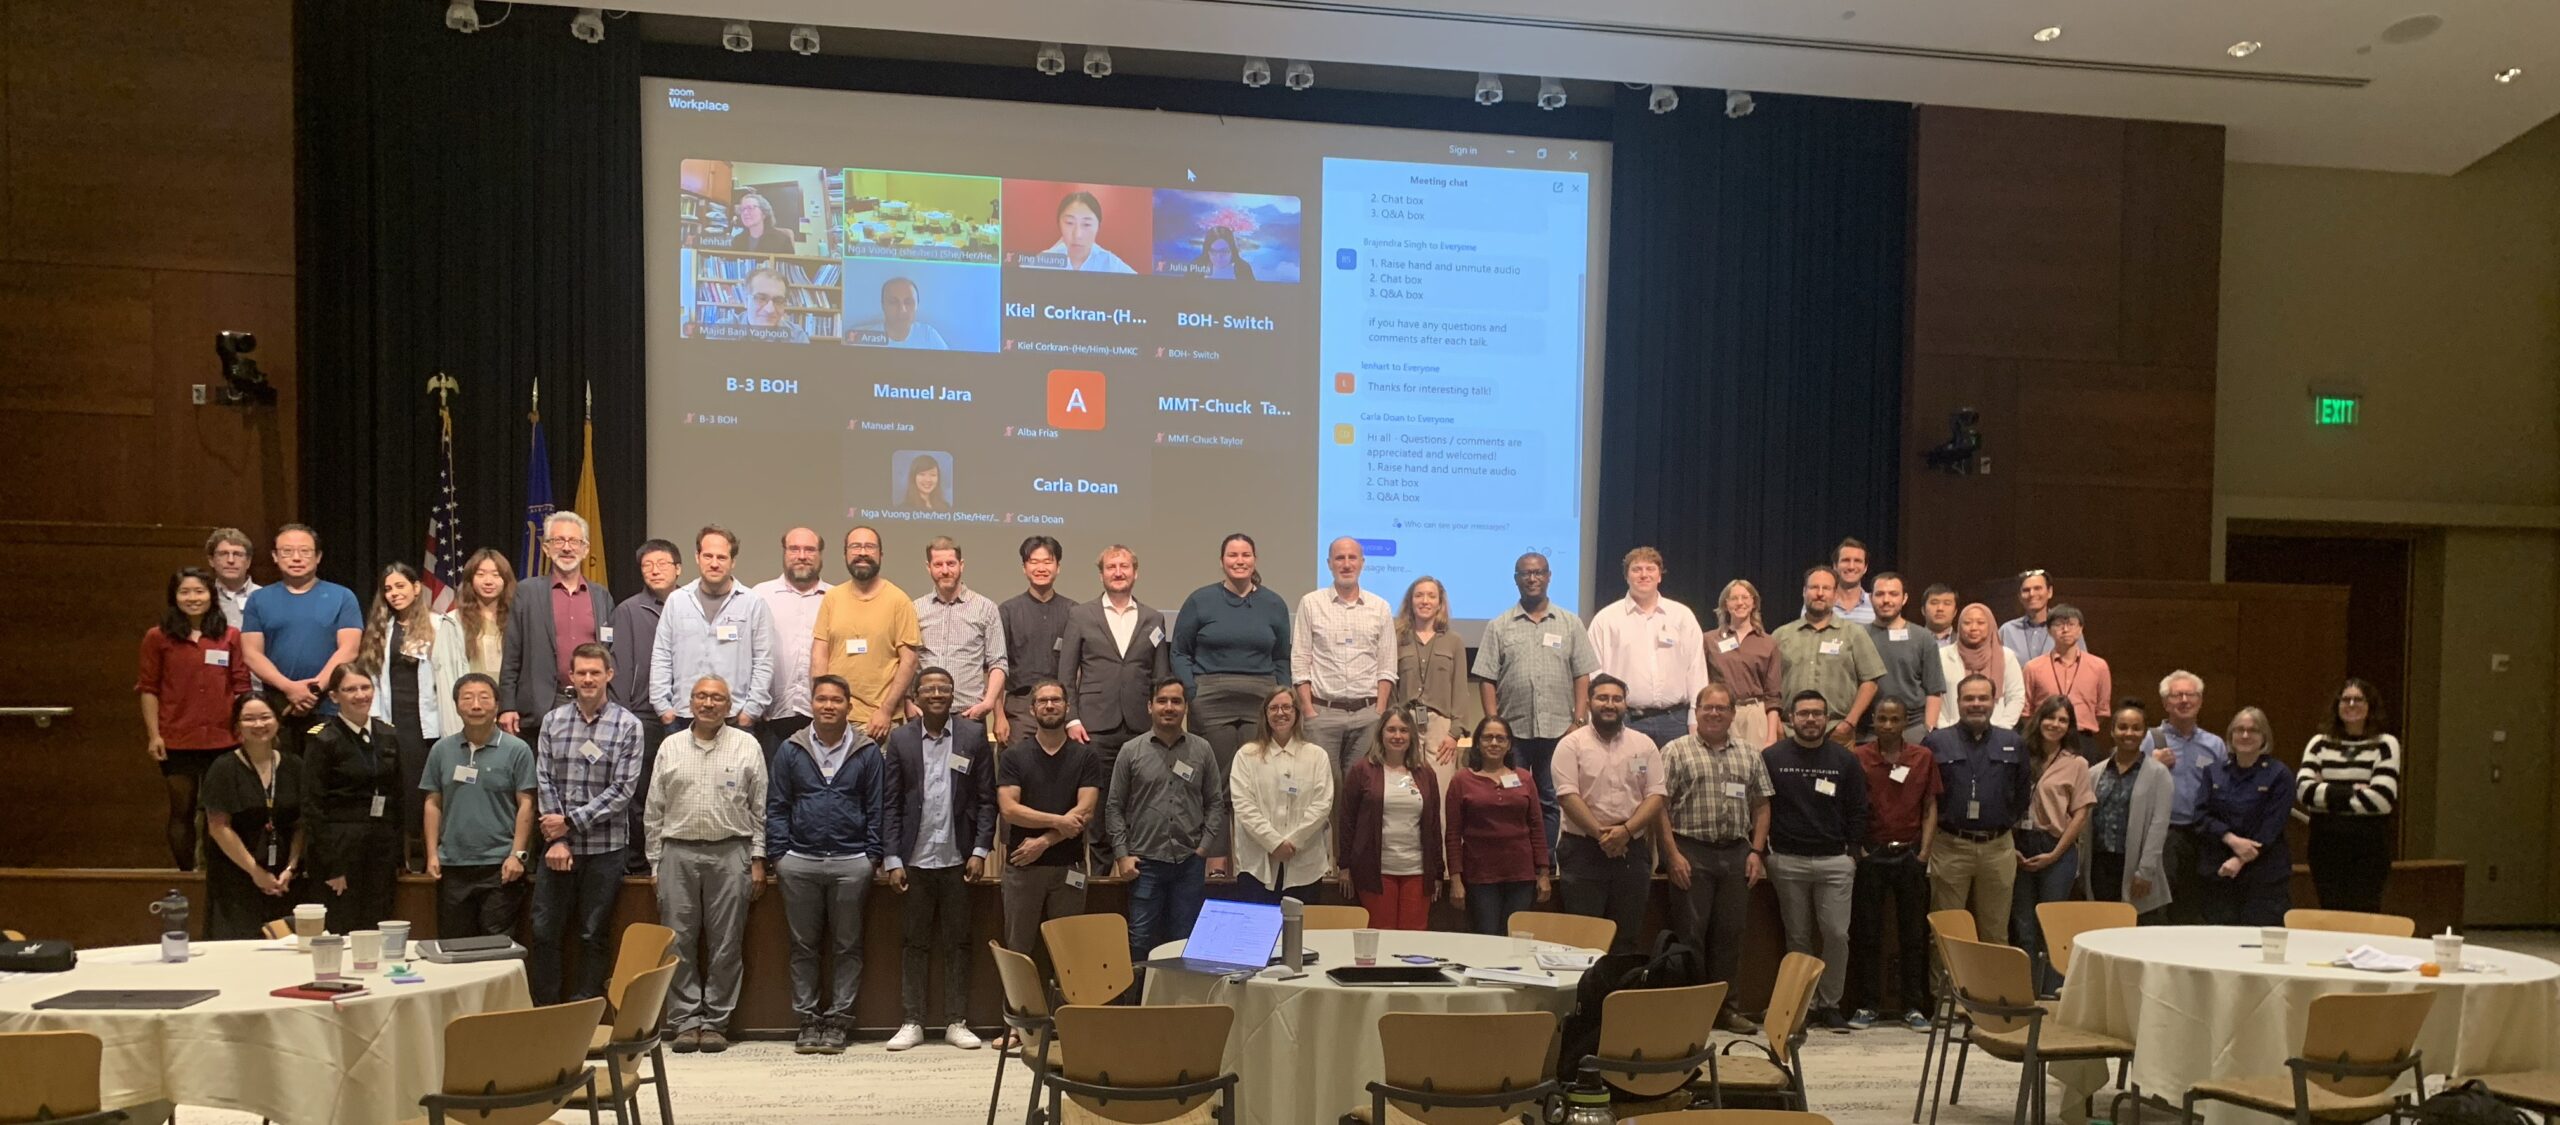
LANZAS: This project is a collaborative effort between groups at three universities: the NC State College of Veterinary Medicine, the Washington University School of Medicine in St. Louis’ infectious disease team and the University of Tennessee’s math department. We have eight faculty and up to 20 grad students and postdocs involved. You need a lot of expertise to pull this off!
Q: What did your research process look like for this project?
LANZAS: This data comes from 353,000 patients in four different hospitals within a health care system in St. Louis that works with Washington University — I have a longstanding partnership there. That data includes all the admissions of those hospitals between 2017 and 2022. Then it took us pretty much a whole year to clean that data and put it together before we could analyze it hands-on.
JOSHI: I started in January, and I did a lot of troubleshooting initially with the machine learning model and its decision trees. Most people at this point probably have a decent perspective about how AI learns, but a model will only learn as much as you feed it. So the first issues that we had to tackle were, what can we give the model, how is our data structured and how does that impact our model?
When we give that data to the model, the model takes it and essentially creates decision tree after decision tree to optimize the algorithm. It’s saying, ‘I need to be able to correctly classify all of these incidences as positive or negative cases, and I need to be able to process this within a certain degree of error.’ It’s learning what splits, or data subsets, it can create that give it enough information to create further splits. In our case, we’re giving it all the disease risk factors and telling it, ‘I want you to find out what information goes into deciding whether or not I have a health care-associated infection,’ and then it ranks all of our different factors to find what gives us the most information about HAIs. It puts that highest-clarity split at the top, and then it continues to branch off using different features at each node afterward, trying to optimize for correct classifications.
And it was a lot of just trial and error, comparing our test statistics’ rates of people who were truly positive and negative for HAIs and comparing it with the model’s classifications.
LANZAS: One of the challenges in general with infectious disease is that oftentimes the number of positives that you have is very small compared to all the number of negatives, and that makes a model very difficult to predict.
Q: How did the College of Veterinary Medicine support your team and this project throughout that process?
LANZAS: I have to give a big shoutout to the grants office because this has been a very complex project with all these other universities involved. There’s been a lot of need for setting up budgets, and the grants office has been really fantastic at supporting our work.
JOSHI: I would definitely like to thank IT, because they helped me with some issues that I’ve had with this machine. They are a godsend.
And then also a quick shoutout to the coffee shop on campus for keeping Cristina and myself awake. I would also like to acknowledge the library as well, because that has been an excellent place to just sit down, zone in, focus and work. And, of course, shoutout to the Research Building as well: the space, the environment and the people.
